Py Contest
Winning $5K With Python & TimeSeries Tips/Tricks
On Sunday night, I saw the below tweet.

I like competitions, so I was definitely down.
The only problem was that it was 11PM when I saw the tweet, and he posted it at 6PM. And I was pretty sure if I waited until the next day, it would be too late to finish in the top 5.
So, I read over the rules and came up with a gameplan so that I could finish that night without feeling like a zombie the next day.
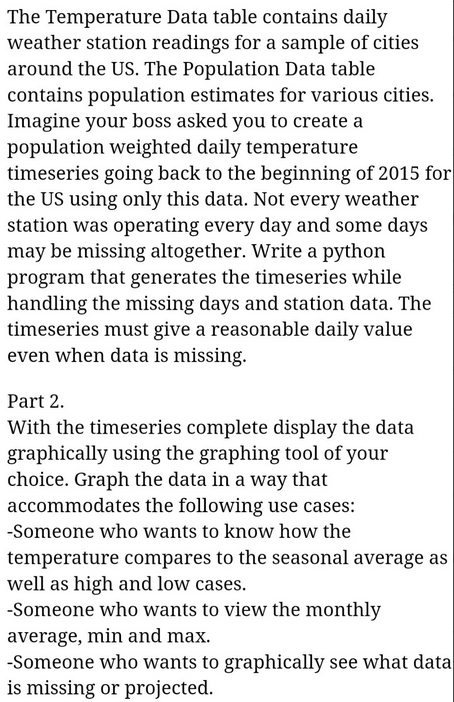
Contest Prompt
My Gameplan
11:00-12:30 | Clean And Structure Data
12:30-1:30 | Do the Analysis
1:30-2:00 | Create Graphs and Cleanup/Comment Code
It was an aggressive timeline, but for the most part I was able to hit those marks. I was rather lucky, because I’m pretty experienced with timeseries data, so I didn’t have to waste too much time ‘thinking’ and could just blitz through the different steps.
Step One - Clean And Structure Data
This was the step that knocked out most people. The data they provided was deceptively filthy. The datasets we needed to join were superficially similar, but you really had to pay attention to your joins in order to not lose or duplicate data. For some reason, I feel like people pay a little less attention to 'join' details when they’re working in pandas as compared to SQL (maybe the default behavior is a little less explicit in pandas?).
This is the important but kinda boring side of data analytics, so I won’t write about this too much unless people are interested.
Step Two - Analysis
We were required to return a temperature for all dates, even for dates where there were no temperature readings. Since we couldn’t use any outside data, I just used a straight-line interpolation method.
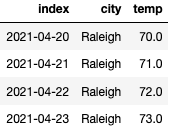
(the below is a toy example, the actual data had 5+ years of data for over 40 cities).
We’re missing the two dates between the 20th and the 23rd and need to provide values for those dates.

To do that, we’ll make the date the index and populate the missing temperature data using a straight-line average.

Look, we now have reasonable temperature values for the missing dates.
Another request was to create a ‘daily national temperature’ that was weighted by the population of the 40 cities in the dataset. It sounds rather intense, but luckily since we already combined all of that information into one dataset, we simply have to run a standard weighted average formula against our data.

There were some additional steps, but this is the general idea!
Step Three - Graphing
For the time series graph, I went with Plotly so that you can interactively hover all of the values and get a precise reading for particular days. I had a brief minute of panic, because when I tried to transfer my local code to the shareable version (Colab), it didn't work. Turns out Colab is currently running a very old version of plotly, so I had to update the version.

For the monthly data, I aggregated everything at the ‘month’ level and then used a box-and-whiskers plot to display the temperature ranges.
(Example of the max data)

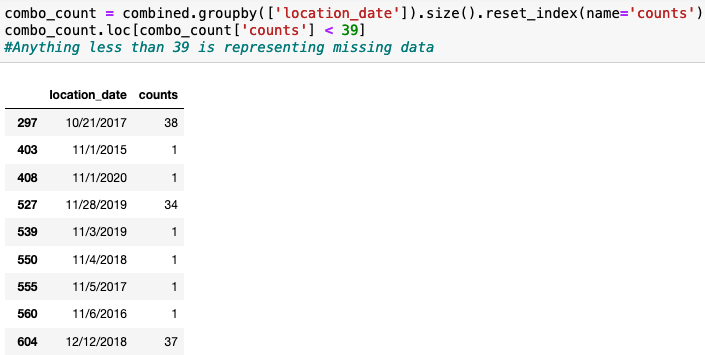
To display the dates that were missing temperature data, I just used a simple table.
It was 2:00 at this point, so I loaded everything into github and sent in my submission. I thought my accuracy and completion speed were probably good, but I was worried that I started it too late and 5 other people had already submitted before me.
Conclusion
Success!
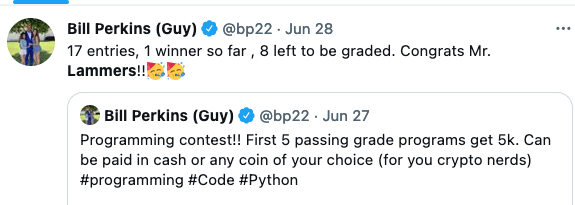
Perkins misspelled my name, but for $5k I will allow that haha
In hindsight, I didn’t need to stay up so late to complete this. The only other person to successfully complete it submitted a few days after I did. The fail rate was quite high.
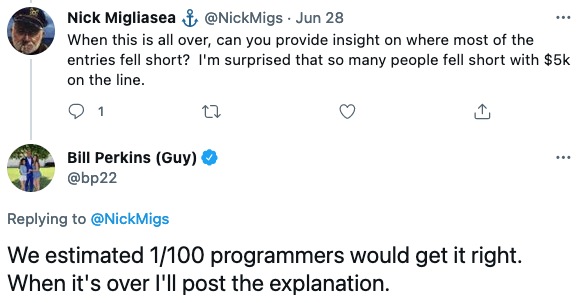
Perkins' team thought that only 1/100 programmers would get it right. As much as I’d like to anoint myself the PROGRAMMING KING, I think the success rate is very dependent on your professional background. I think over 70% of the data analysts I’ve worked with would’ve gotten it correct. If you’re not used to dealing with imperfect data though, I can definitely see how it would be tricky.
If you're interested in data/finance stuff, follow me on twitter or sign up for emails below! https://twitter.com/MattHLamers
I spent part of the money on a couch!
