Introduction
What are we doing?
In many data analytics courses, there’s a disclaimer that “in the real world, the actual data will be a lot messier…yada yada .. good luck!”
To try and help bridge that gap, we're going to walk through an example of how to collect and clean data from a web page.
Project Background:
Every three months, publicly traded companies announce their quarterly revenue and profit. If the announcement does not match investor expectations, there can be a large impact on the stock price.
One common belief among investors is that the “top-line” (revenue) announcement is the most important metric for high-growth companies, while the “bottom-line” (profit) announcement is the key indicator for established companies.
This sounds right, but let’s quantify this and prove whether this is actually true.
To test this, we’ll need to collect a list of the actual quarterly revenue/profit numbers, as well as the investor estimates.
The quarterly results are publicly available and pretty easy to retrieve, but the investor estimates are much more difficult to find. There is a nice, clean dataset containing this info, but it costs $1,800 dollars a year. I won’t make you buy that for this tutorial, so we’ll have to make do with a messier dataset :)
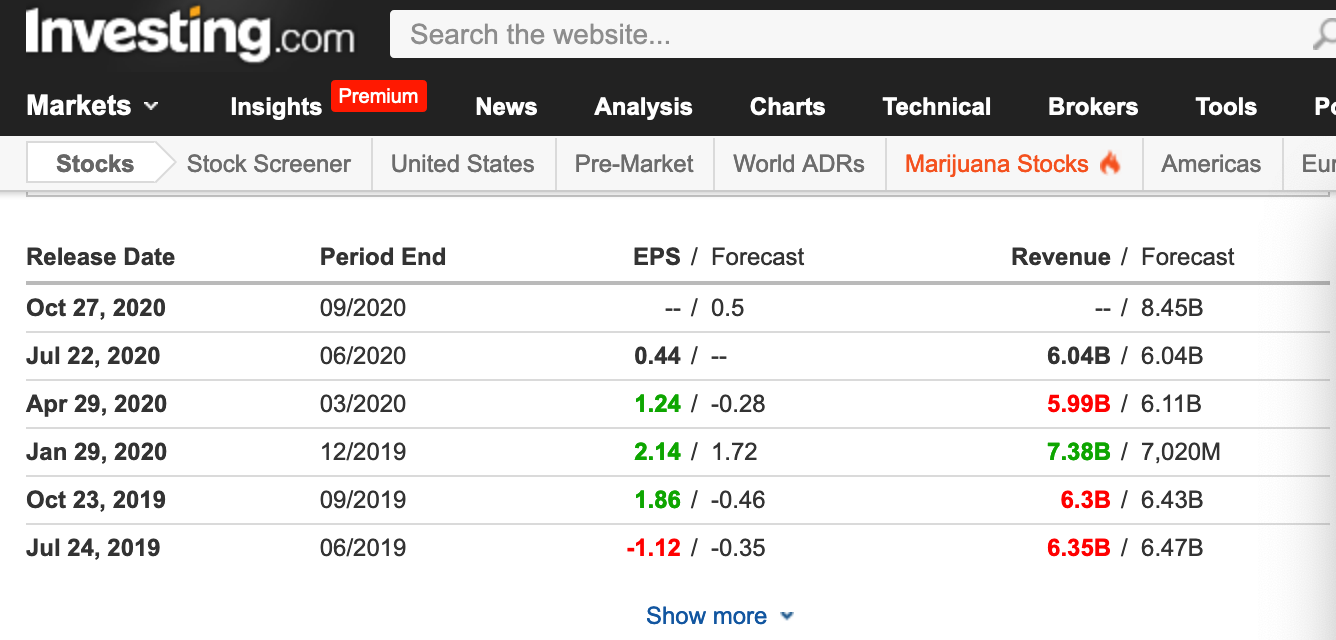
The best public datasource I could find was investing.com, which contains all of the necessary info in a web table.

There’s no API or export functionality, so we’ll need to scrape it.
When scraping, I try to keep it simple and just use the python requests module to pull down the raw html. However, the problem here is that most of the dataset is hidden behind the “Show More” button and won’t exist on the initial page load.
The clever solution would be to simulate clicking the ‘show more’ button by sending a POST request. I used the Firefox dev tool to see what info that “show more’ button is sending.

The browser is sending ‘pairID’ and ‘last_timestamp’ values to the server when that button is clicked. It’s probably possible to reverse-engineer this, but it looks like a pain, so I gave up on this route. I’ll always try the clever and efficient route first, but I try not to get too attached to it.
Instead, we’re going to use a package called Selenium to ‘click’ on that ‘Show More’ button.
First, we just have to tell Selenium what page we want to visit.
url = 'https://www.investing.com/equities/tesla-motors-earnings'
driver = webdriver.Chrome('/Users/Me/Downloads/chromedriver')
driver.get(url)
Now, we define the button with the “show more” text as the one we’ll interact with.
python_button = driver.find_element_by_partial_link_text('Show')
On the web page, the “show more” button exists until it reaches the last date – then it disappears. Since we don’t know how many dates there will be, we just tell the program to keep clicking the button until it disappears.
moreButtons = True
while moreButtons == True:
    try:
        python_button.click()
    except:
        moreButtons = False
Now we can scrape the page and turn the complete dataset into a dataframe!
soup = BeautifulSoup(driver.page_source, 'lxml')
table = soup.find_all('table')[1]
df = pd.read_html(str(table),index=False)
Cleaning Data
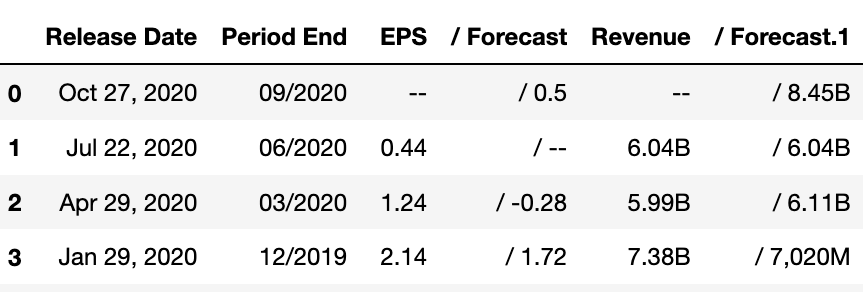
Look at this filthy, filthy dataframe. There are random slashes everywhere, the datatypes are all wrong, and we have some numbers listed in billions and some in millions. Let's fix our Frankenstein's monster.

First, we’re going to rename the column headers to something more sensible.
epsDF = epsDF.rename(columns={'Release Date': 'earningsReleaseDate', 'Period End': 'quarterEnd', '/ Forecast': 'epsForecast', '/ Forecast.1': 'revForecast', 'Revenue': 'revenue',})

Now we’re going to get rid of all these random slashes in our columns.
epsDF["epsForecast"] = epsDF["epsForecast"].replace({'/':''}, regex=True)
epsDF["revForecast"] = epsDF["revForecast"].replace({'/':''}, regex=True)

We’ll want to do some calculations with the revenue forecast number, so we need to convert it from a string to a number (float). First, we throw the “M” & “B” abbreviations into another column so that the number and units are separated. We’re also removing the commas since those are technically strings.
epsDF['revForecastUnit'] = epsDF['revForecast'].str.extract('([A-Z])', expand=True)
epsDF['revForecast'] = epsDF['revForecast'].map(lambda x: x.rstrip('MB'))
epsDF['revForecast'] = pd.to_numeric(epsDF['revForecast'].replace({',':''}, regex=True), errors='coerce')

Instead of having some numbers in millions, and some in billions we’ll un-abbreviate everything so that the math is easy.
epsDF['revForecast'] = epsDF.apply(lambda row: row[['revForecast']]*1000000 if row['revForecastUnit'] == 'M'
     else row[['revForecast']], axis=1)
epsDF['revForecast'] = epsDF.apply(lambda row: row[['revForecast']]*1000000000 if row['revForecastUnit'] == 'B'
     else row[['revForecast']], axis=1)

Now, just a little bit of matrix math to find the difference between the expected results and the actual results.
epsDF['epsDiff'] = epsDF['EPS'] - epsDF['epsForecast']
epsDF['revDiff'] = (epsDF['revenue'] - epsDF['revForecast']) /epsDF['revForecast']

Let’s add some columns to keep track of the quarter and year. This will make later QoQ and YoY comparisons easier.
epsDF['qtr'] = pd.to_datetime(epsDF.quarterEnd).dt.quarter
epsDF['year'] = pd.to_datetime(epsDF.quarterEnd).dt.year

We’ll be measuring how the stock price reacts to the earnings announcement, so we need to pull the stock prices for the days before and after the announcement.
Since this will take quite a few steps, we’ll break it out into a separate function called “prices”.
We’ll use the pandas “BDay” (business day) keyword to find the dates 5 days before and after the announcement. Once we have the date range, we can just feed it into the Yahoo Finance library to get the price history.
def prices (row):
    tickerSymbol = 'TSLA'
    tickerData = yf.Ticker(tickerSymbol)
    tickerDf = tickerData.history(period='1d', start=row.earningsReleaseDate - BDay(5), end=row.earningsReleaseDate + BDay(5))
    tickerDf['datez'] = tickerDf.index
    tickerDf = tickerDf[['datez','Close']]
    gee = tickerDf.values.tolist()
    return gee

epsDF['priceHistory'] = epsDF.apply (lambda row: prices(row), axis=1)

We’re done! Still a lot more to do on the analysis side, but we’ll save that for later.
If you’re interested in being notified of new posts, feel free to sign up using the below form.